Leading indicators
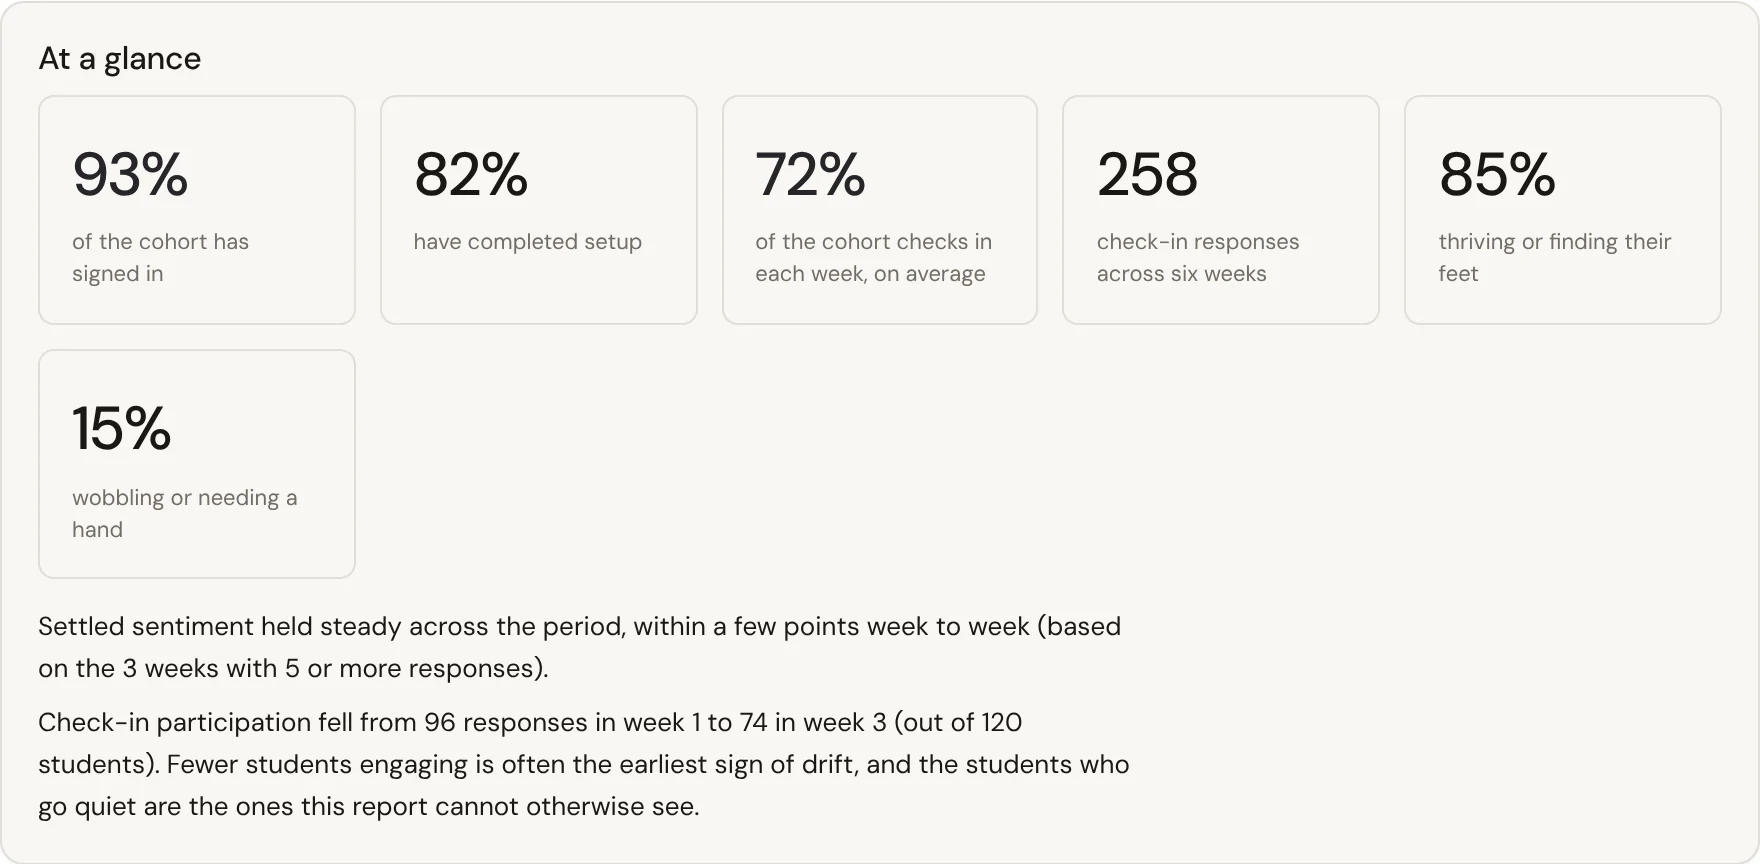
See how commencing students are travelling in the weeks before census.

At a glance
Signals that move first
They shift weeks before census attrition or a survey would show anything.
Read in aggregate
All your students, or one group at a time, without predictions about anyone.
Built to act on
Insights suggests next steps, and Needs attention lists who might need a hello.



Most of what reaches you arrives after the window
Universities have plenty of lagging data: census attrition, end-of-semester surveys, results. All of it arrives after the window where early support is easiest. The signal that moves first, how students are settling, is rarely asked for at all.
Read the weeks in between, from what students tell you
First Six reads it from what students say: a weekly check-in, an optional reason when they're wobbling, and the help they ask for. Your team gets the weekly pulse, what's weighing on students and when, participation, and help response times. Every view is aggregate.
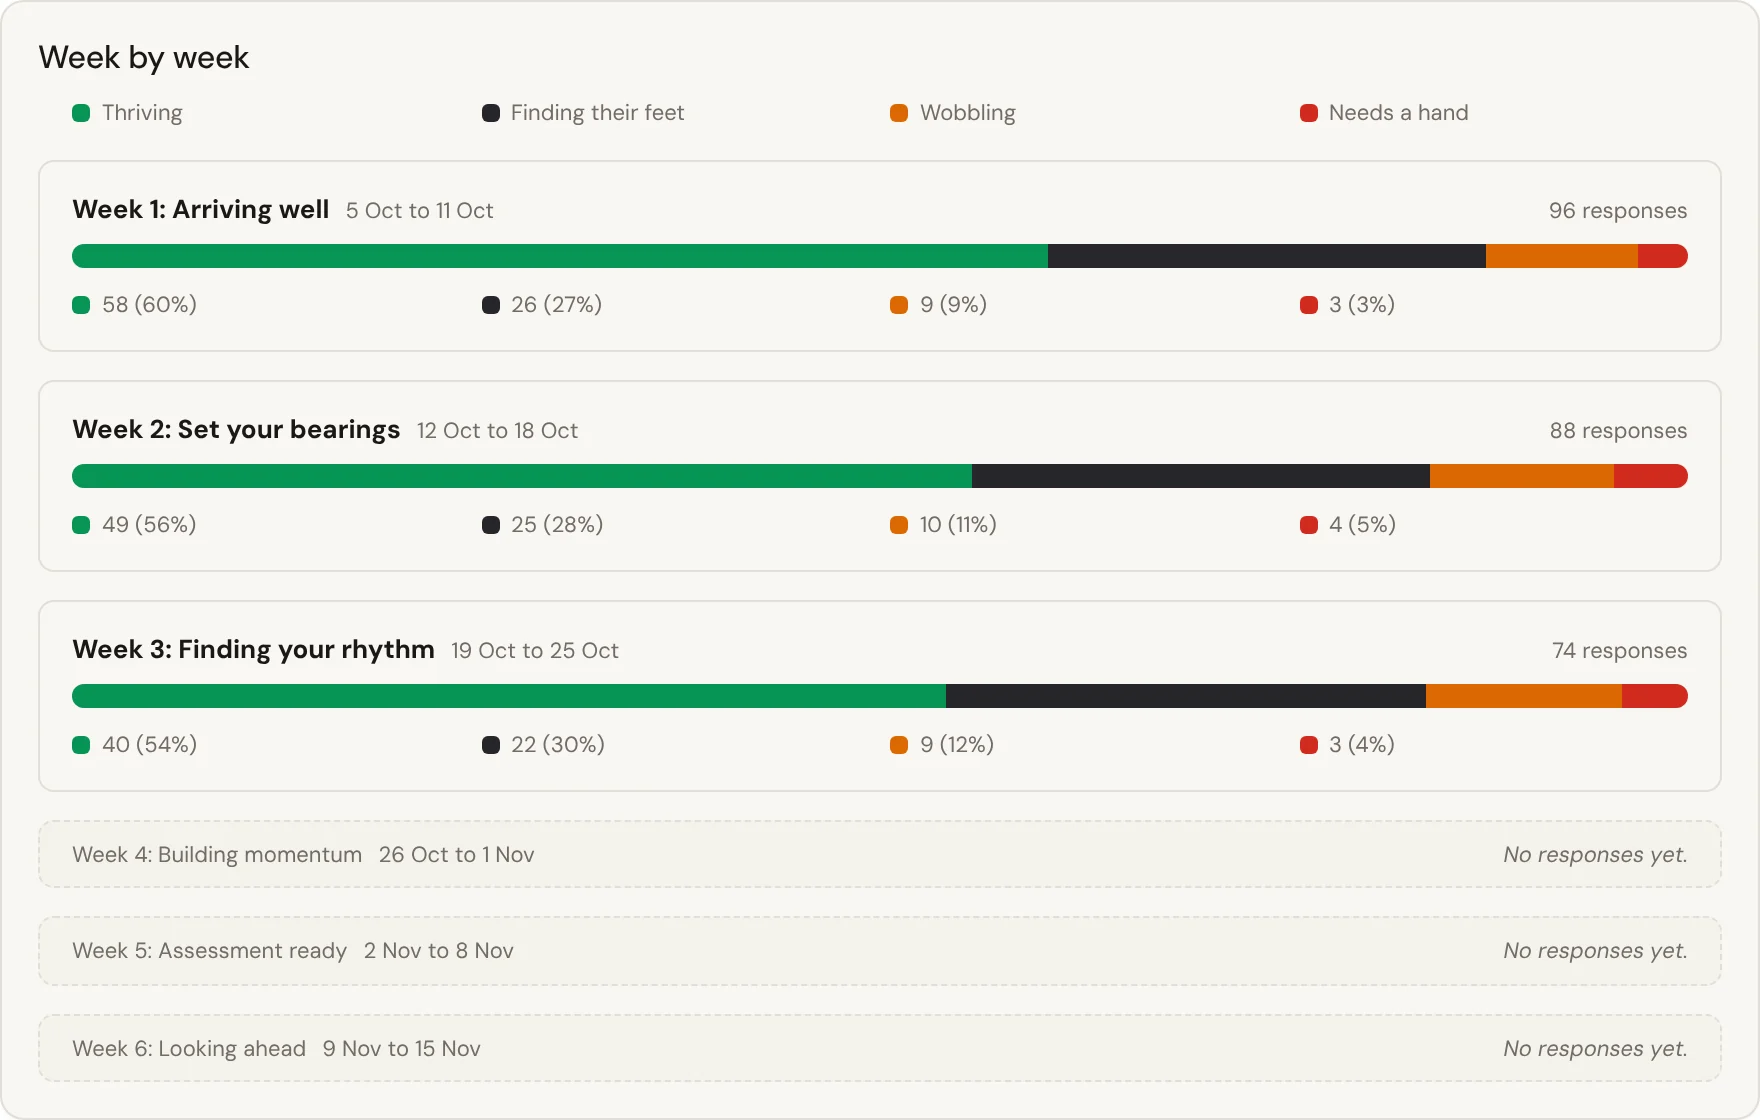
What you can read, week by week
- WobblingTheir check-in says it's hard
- Not startedNever answered a check-in
- Gone quietQuiet for three weeks
What you can expect
Signal weeks before census or surveys
See check-ins dip in week two, instead of in a report twelve months later.
A read on service quality
Response targets and resolution for help requests, tracked like a service desk.
Groups compared, one at a time
Compare a campus, degree or first-in-family group with all your students.
Silence noticed early
Not started lists students who have never checked in, so your team can say hello.
FAQs
Can't see your question? Ask us and we'll reply.
Does First Six predict which students will drop out?
No. There's no predictive scoring of individual students. Insights shows trends in aggregate, and the Needs attention list uses three published rules that read check-in answers only.
How is this different from LMS or student system analytics?
Your LMS measures activity and your student system records enrolments. First Six measures what students tell you in the weeks between: check-in answers, participation, what's weighing on them, and help response times.
How do we connect it to attrition?
Compare leading indicators from one intake to the next, and join our CSV exports with your own enrolment data to see how they relate to attrition.
Where is our student data stored?
The data of record is hosted in Australia on AWS in Sydney, with each institution's records kept apart by row-level security. Every subprocessor is listed on our Knowledge Base.
Where to go next
The features behind it
For leadership
- DVC & PVC StudentsEarly signs of how commencing students are going, in the weeks before census, so a DVC or PVC can act while it still counts.
- Director of Student ExperienceMeasure student service the way you already measure IT, with figures a Director of Student Experience can report upward.
- Equity & InclusionSee how first-in-family students and each campus are travelling, week by week, so inclusion work has evidence behind it.
See the weeks before census
Book a walkthrough and we'll show the leading indicators from the weeks between enrolment and census, using sample students.