For DVC & PVC Students
Early signs of how commencing students are going, in the weeks before census, so a DVC or PVC can act while it still counts.



See the first weeks while you can still act on them
Enrolment data tells you who has left. The weekly check-in shows how commencing students are going in their first weeks, while there is still time to respond, and points to where to look.
What you can track
Each figure below is already in First Six, and each card shows where to find it.

Check-in trend across the first weeks
How students' weekly check-in answers move across the first weeks, read as a curve.
In the console: Insights, Pulse, week by week, with the share of settled answers rising or falling.

The weeks before census date
The share of students saying they are wobbling or need help in the weeks before census, and what is weighing on them. Use it as a prompt to act.
In the console: Pulse and What's weighing on students, read against the census date in your term setup.

First-in-family, campus and degree breakdowns
The same weekly picture narrowed to first-in-family students (where your roster supplies the flag), a campus or a degree, so you can see whether one group is travelling differently.
In the console: The Pulse lens and the Where to look this week panel. Aggregate only, one group at a time.

Participation and activation
How many commencing students have signed in and set up, and the share answering the check-in in a typical week, so you know how far to trust the signal.
In the console: Insights, activation and average weekly check-in coverage.

Support for Students evidence
A 90-day report of support activity: help requests raised, resolved and marked crisis, and check-ins by sentiment, all aggregate and withheld below five students.
In the console: The Support for Students report, printable as a PDF, with CSV exports behind it.
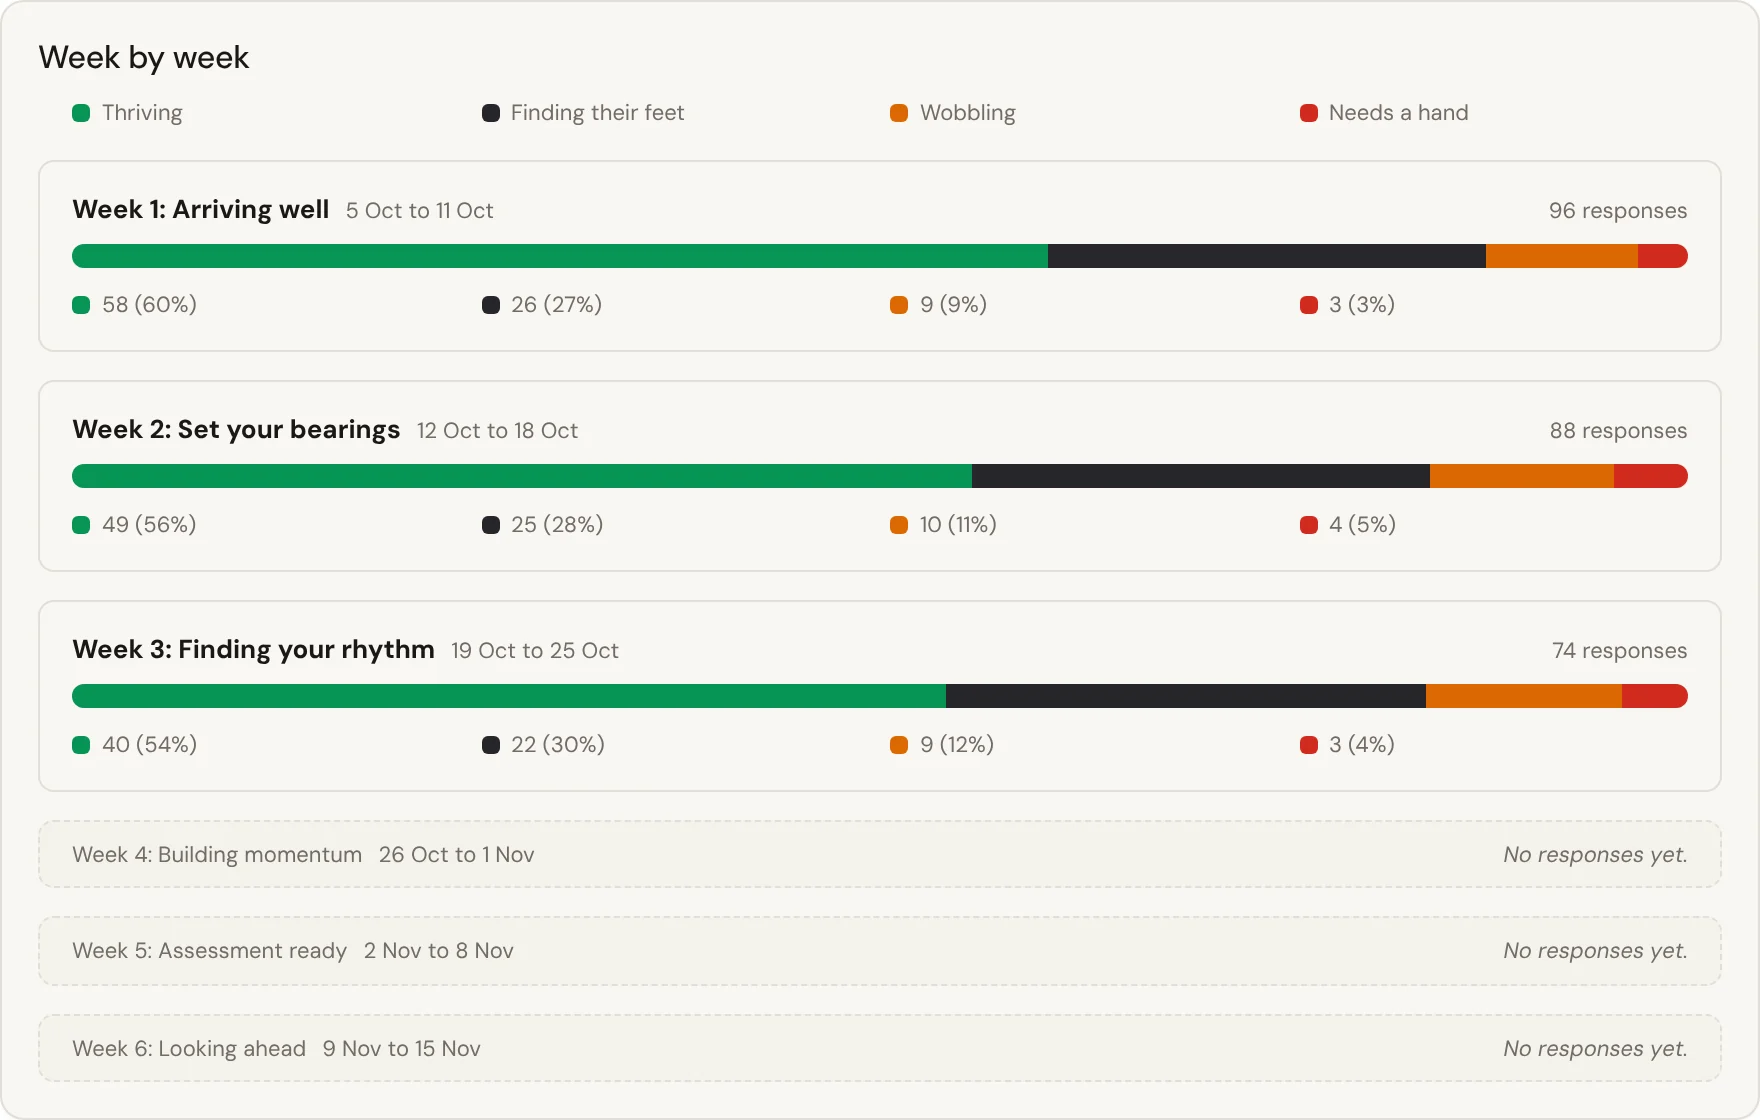
The whole picture, one week at a time
Cohort insights shows how students said they were going in each week, so a dip shows up in the week it happens.
See it with your own students
See how commencing students are going before census date.