
First-year attrition just fell to a decade low. The credit has been claimed, but the explanation has not been earned.
First-year university attrition fell from 14.7% to 12.2% in one cohort. What the 2024 data can and cannot explain, and what transition teams should do.
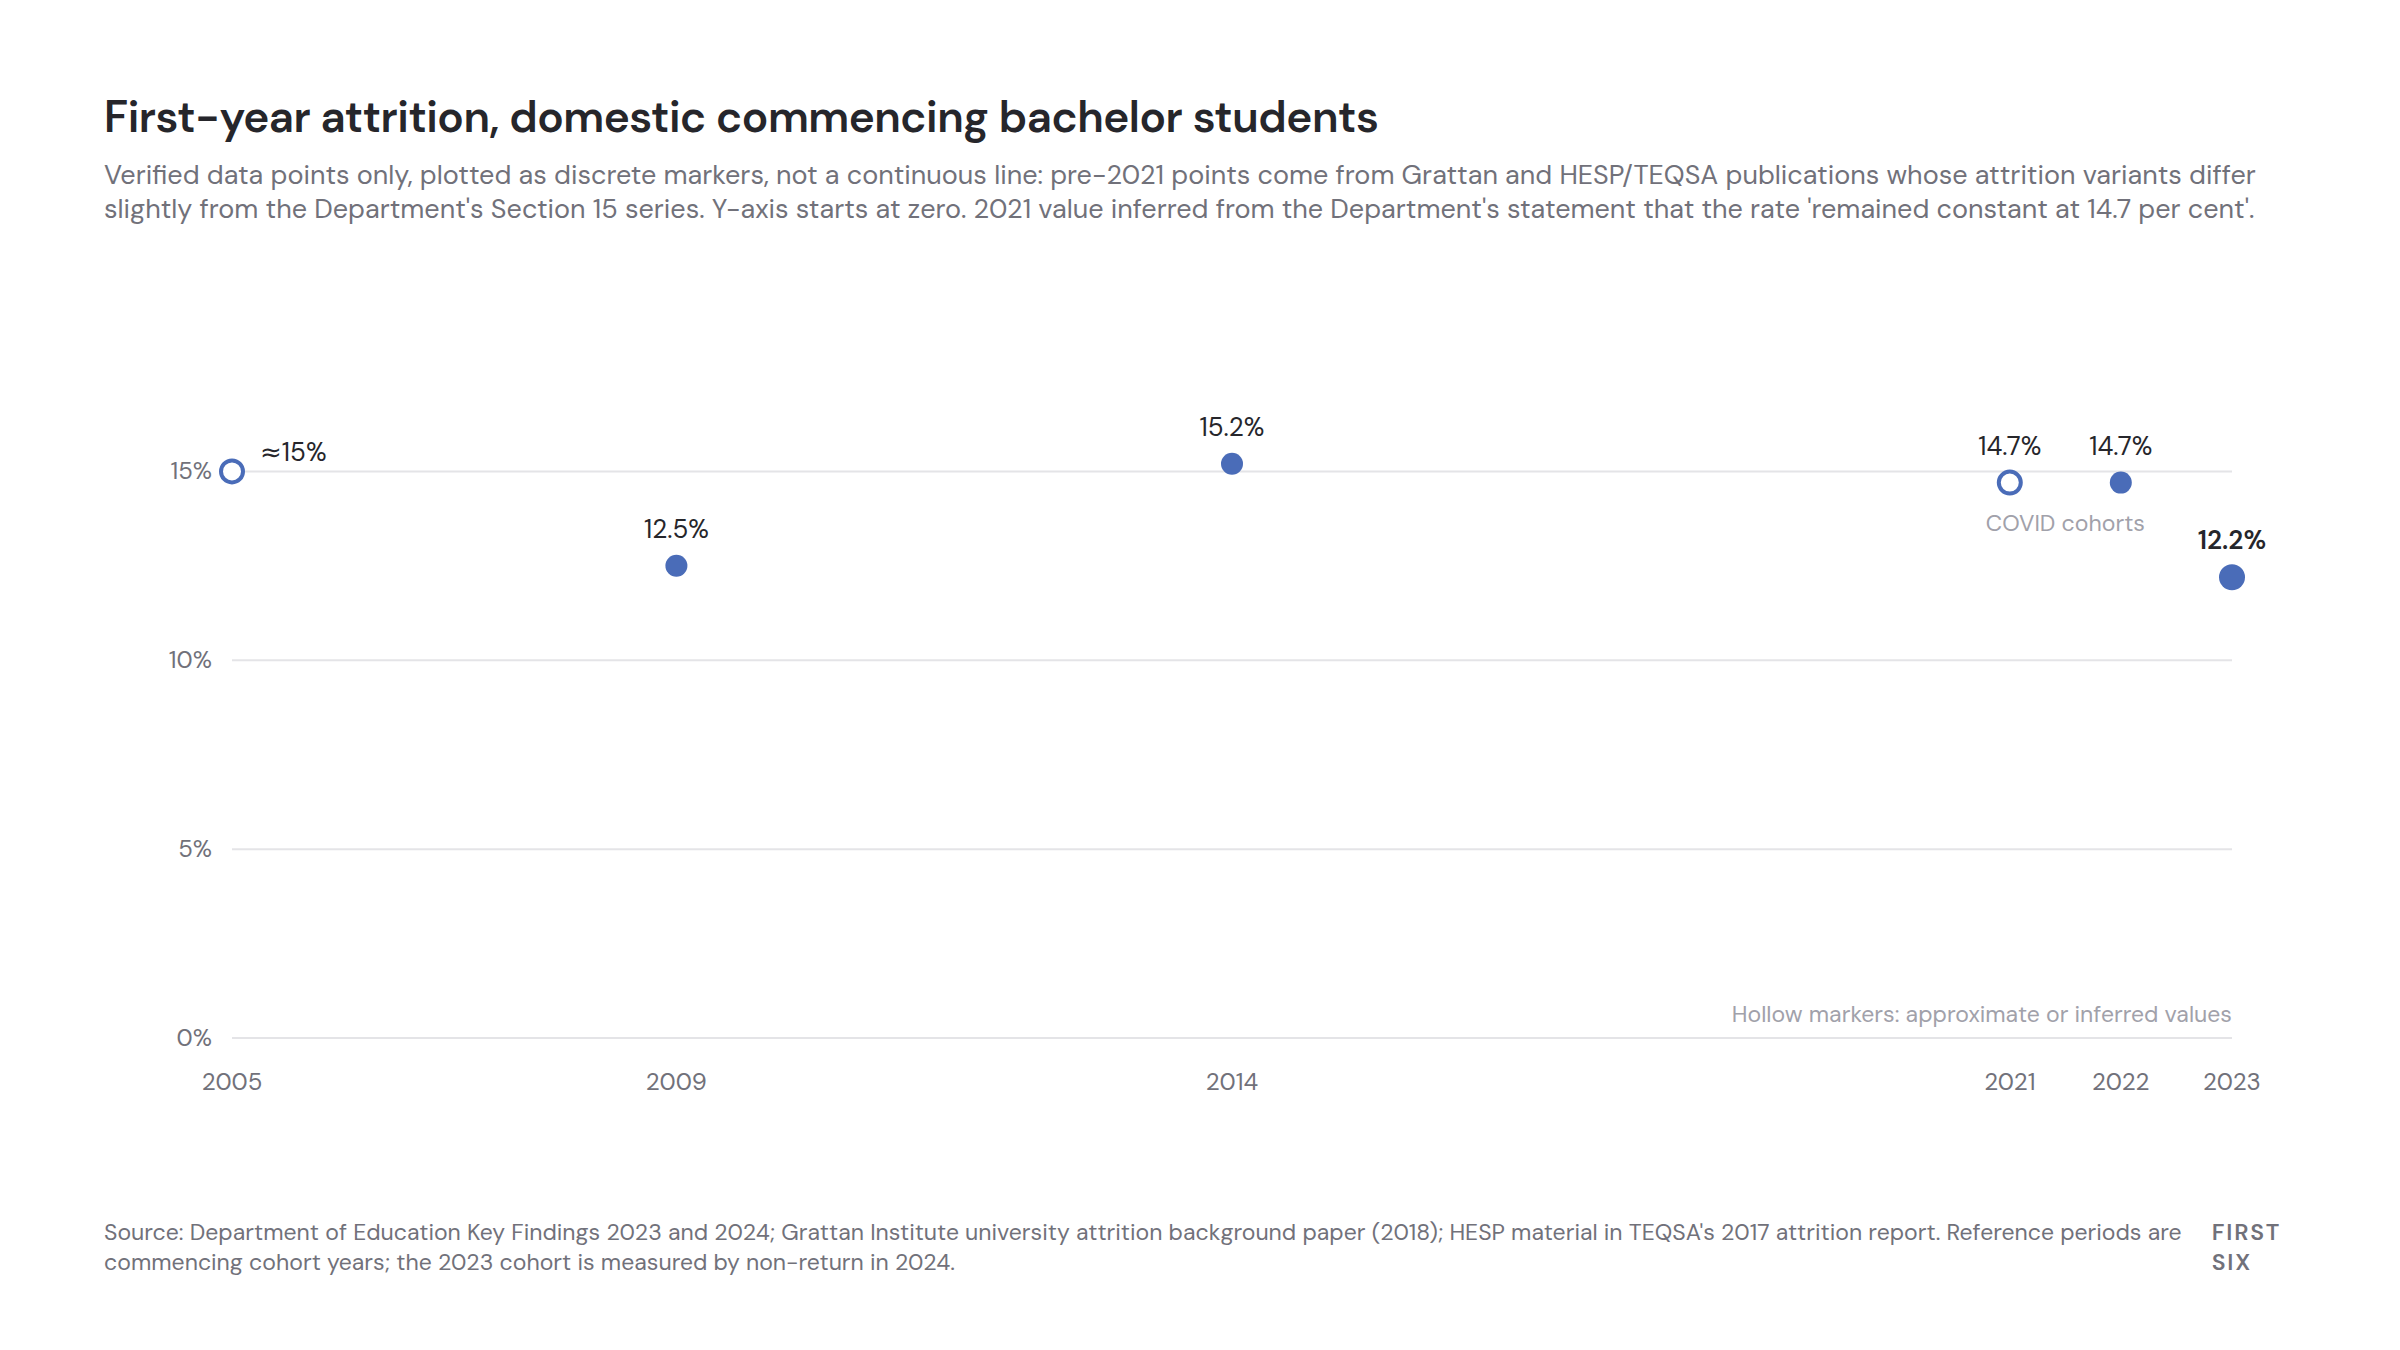
The first-year attrition rate for domestic commencing bachelor students fell from 14.7 per cent for the 2022 commencing cohort to 12.2 per cent for the 2023 cohort, the lowest level in at least a decade, according to the Department of Education's Key findings from the 2024 Higher Education Student Statistics. The students behind it commenced in 2023 and neither completed nor returned to any higher education provider in 2024. That is 2.5 percentage points in a single year, after two years flat at 14.7.
The fall has not gone unclaimed: the Minister for Education cited it in a September 2025 media release, and the Department's own commentary offers explanations. But they have been offered, not weighed. Nobody has asked which of them the tables actually support, and almost all are stories about who enrolled, not about what happened to students after they arrived.
The distinction matters. A compositional fall reverses on its own timetable, and no transition program deserves credit for it. Persistence under economic pressure stores up a completion problem. A genuine improvement should be nameable. The published data cannot yet separate these; which you believe should determine what you do next February.
The number, before anyone spends it
Definitions first, because several variants of "attrition" circulate. The headline figure is the adjusted attrition rate for domestic commencing bachelor students across Table A and Table B institutions, by commencing cohort year, measured one year on. "Adjusted" is load-bearing: a student who switches institutions is not attrition; only those who leave higher education entirely count. The Department's Section 15 tables on attrition, success and retention publish the full set of variants; older series sit on slightly different definitions, so the same era can carry different numbers.
The recent history: 14.7 per cent for the 2022 cohort, unchanged from the year before (the 2023 Key Findings reported it as "constant at 14.7 per cent"). Then 12.2. For perspective, Grattan's 2018 background work put the rate at 12.5 per cent in 2009 and 15.2 per cent by 2014; Higher Education Standards Panel material in TEQSA's 2017 attrition report put it near 15 per cent in 2005, on a variant that may not match the current series exactly. So 12.2 is not unprecedented; it is roughly 2009 again. "Lowest in at least a decade" is the defensible superlative. The Department's Key Findings commentary cautions against over-reading short-term trends given the pandemic-distorted 2020 and 2021, while noting the decline from 2018 "seemingly continued, when excluding 2020 and 2021".
The credit has been claimed.
In September 2025 the Minister for Education announced that "attrition rates for domestic undergraduates are at a ten year low at 12 per cent in 2024, down from 15 per cent in 2023", in a release promoting needs-based funding rolling out "from next year". That sentence relabels commencing cohorts as calendar years and rounds 12.2 to 12 and 14.7 to 15. More importantly, the timing does not work: the 12.2 cohort enrolled in early 2023 and made their stay-or-go decisions before needs-based funding had begun. The release claims the credit; it does not earn the explanation.
The official explanations are about who enrolled
The Department's Key Findings commentary offers its own account of the fall. It points to the availability of alternate pathways under generally positive employment conditions, and to the introduction of Fee-Free TAFE and VET places from January 2023. Read that carefully. It says school leavers who would otherwise have enrolled, wavered and left instead went to TAFE or into work and never commenced. That is not universities getting better at holding students. It is the at-risk margin of the intake diverted before census date. The denominator changed.
Andrew Norton's June 2025 analysis of what explains delays in attrition adds the mirror image: the labour-market pull that dragged enrolled students out of study has eased, with twenty-something full-time employment back at "normal 2010s levels, reducing a pull factor out of study". Both forces are real. Neither is anything a dean of students did.
One strand of evidence favours the flattering story. Domestic student success rates, the share of attempted units passed, reached a ten-year high of 87.9 per cent in 2024. Genuine improvement would produce exactly this pairing: success up, attrition down. But the same diverted marginal enrolments that flatter attrition also flatter the pass rate. The pairing is consistent with the good story; it does not establish it.
The equity tables are the right test, and they are not yet decisive
The best published evidence for separating the stories is the equity breakdown from the Australian Centre for Student Equity and Success (ACSES). Its 2026 update on retention rates in Australian higher education found first-year retention for 2023 commencers rose 2.6 percentage points to more than 86 per cent, across every equity group. But the levels remain far apart: 75 per cent for First Nations students and 84 per cent for students with disability, against 88 per cent for students outside the equity groups, who continue to record markedly higher retention.
The published summaries do not say whether any of those gaps narrowed, held or widened, and that unglamorous detail is the whole test. Targeted transition investment exists to narrow gaps; sector-wide forces act on everyone at once. So if the group-level changes show equity students gaining faster than everyone else, the improvement story earns real evidence, and a tide lifting every group in parallel favours the compositional one. I have not seen anyone put those deltas beside the celebration. Until someone does, the strongest honest statement is that the fall has not visibly closed the sector's oldest gaps, and a rise this uniform is at least as consistent with external forces as with targeted transition work.
The seam: fewer leave early, but not many more finish
Grattan Institute's Dropping out, published in 2018 about the sector of that era, found that more than a quarter of students who start an undergraduate course will leave without a degree. The Department's Completion Rates Cohort Analyses show why it has aged so little: six-year completion for commencing domestic bachelor students edged from 61.8 per cent for the 2017 cohort to 62.3 per cent for the 2018 cohort, still well below the 67.2 per cent achieved by the 2008 cohort. Roughly 38 per cent of a recent cohort had not completed within six years, even as first-year attrition drifted down.
Hold those together: first-year attrition is the best in at least a decade, and completion remains substantially worse than before the demand-driven expansion. Either retained students leave later, or completion simply lags behind, or the two measures have partly decoupled. We will not know for years: the 2023 cohort's six-year completion rate cannot appear until the end of the decade. Anyone declaring the retention problem solved is spending money the tables have not yet paid out.
What it looks like from inside the first semester
I spend my working weeks inside the first six months of university, with the teams who own orientation and transition, and the view from there makes me distrust annual statistics on principle. The decision this statistic records is mostly made between week three and week eight of first semester: the missed second assessment, the timetable that never fit around the shift job, the student who stopped coming and noticed that nobody noticed. The sector then waits a year to see who re-enrols, and publishes the answer a year after that. By the time the 12.2 appeared, the students it describes had decided up to two years earlier. It is a coroner's report presented as a vital sign.
And here is the practitioner's tell that favours the compositional story. First-year teams track their own leading indicators through semester one: orientation attendance, week-by-week engagement, early help-seeking. If the fall had been produced by transition work, those teams would have watched it coming through 2023 and claimed it loudly and specifically. That is not what happened; the figure arrived in a Department publication, mostly as a pleasant surprise. A number that improves without the people responsible predicting it was probably not moved by them, and the honest ones say so.
February is where you place your bet
If you run a first year, you cannot stay agnostic: the next intake arrives in February, and the three explanations demand different preparation. Believe the compositional story, and you plan for its reversal: Fee-Free TAFE settings and the labour market will shift, the diverted students will return to your intake, and the rate will climb back through no failure of yours. Budget and narrate accordingly before a future year's "deterioration" lands on your team. Believe the persistence-under-pressure story, and the problem has moved inside the building: the at-risk student is retained but drifting, and will surface in second-year attrition and the completion tables unless engagement work extends past orientation. Believe the genuine-improvement story, and the obligation is heaviest: name what actually changed, in writing, with its cost, so it survives the next budget round instead of being absorbed as savings.
The fall is real and welcome. But a number this important should not float free of an explanation, because unexplained improvements get claimed by whoever is nearest a microphone and defunded by whoever is nearest a spreadsheet. The explanations published so far lean compositional: the Department's own account is about who enrolled, and the labour-market story is about forces no university controls. If you believe otherwise about your institution, the evidence is in your week-by-week first-semester data, not in the annual release, and February is the deadline for deciding which story you will act on.