
First-year retention rose for every equity group in 2024. A 13-point gap between the highest and lowest-retained groups remains.
First-year retention rose for every equity group Australia tracks in 2024. A 13-point gap between the highest and lowest-retained groups shows why.
In 2024, first-year retention rose for every equity group the Australian Centre for Student Equity and Success (ACSES) tracks. That is a genuinely good result and it deserves to be reported as one. But the group Australian universities retain worst, First Nations students at 75 per cent, and the group they retain best, non-equity students at 88 per cent, are 13 percentage points apart. The national figure that will carry the headlines, retention up 2.6 points to more than 86 per cent, is an average that no group of students actually experienced.
That is not a criticism of the data. It is a statement about what an average is for, and what it is not for.
A genuinely good year, described honestly
ACSES's Retention rates in Australian higher education: Analysis of 2024 data tracks domestic undergraduates who commence a bachelor degree and return the following year, a narrower and more specific measure than “did not drop out”. On that measure, the 2023 commencing cohort returned in 2024 at a national rate of more than 86 per cent, up 2.6 percentage points. Every equity group the report tracks, including First Nations students and students with disability, improved in the same year.
ACSES's series also tracks students from low socioeconomic backgrounds and regional and remote students, and this article does not carry verified 2023-2024 figures for those groups: they could not be confirmed with enough precision this session to publish. A prior edition of the same series shows students with disability sitting toward the better-retained end of the tracked equity groups, not in the middle, so the two-group comparison below is the best-documented part of a wider spread, not the full range ACSES reports.
The Department of Education's separate Section 15 attrition tables point the same direction from a different angle. Domestic commencing bachelor attrition, the share of students who neither returned nor completed, fell from 14.7 per cent for the 2022 cohort to 12.2 per cent for the 2023 cohort. The two figures are not directly comparable: ACSES measures return to study, the Department measures attrition net of completion, and the cohorts, exclusions and denominators differ. What they agree on is direction. Whatever moved in 2023 and 2024, cost-of-living pressure making persistence more urgent, a post-pandemic cohort settling into more typical study patterns, or transition support that is genuinely working better, it moved retention up broadly, not for one group at the expense of another.
None of that is in dispute. What is worth pausing on is what “broadly” hides.
What a 13-point gap actually means
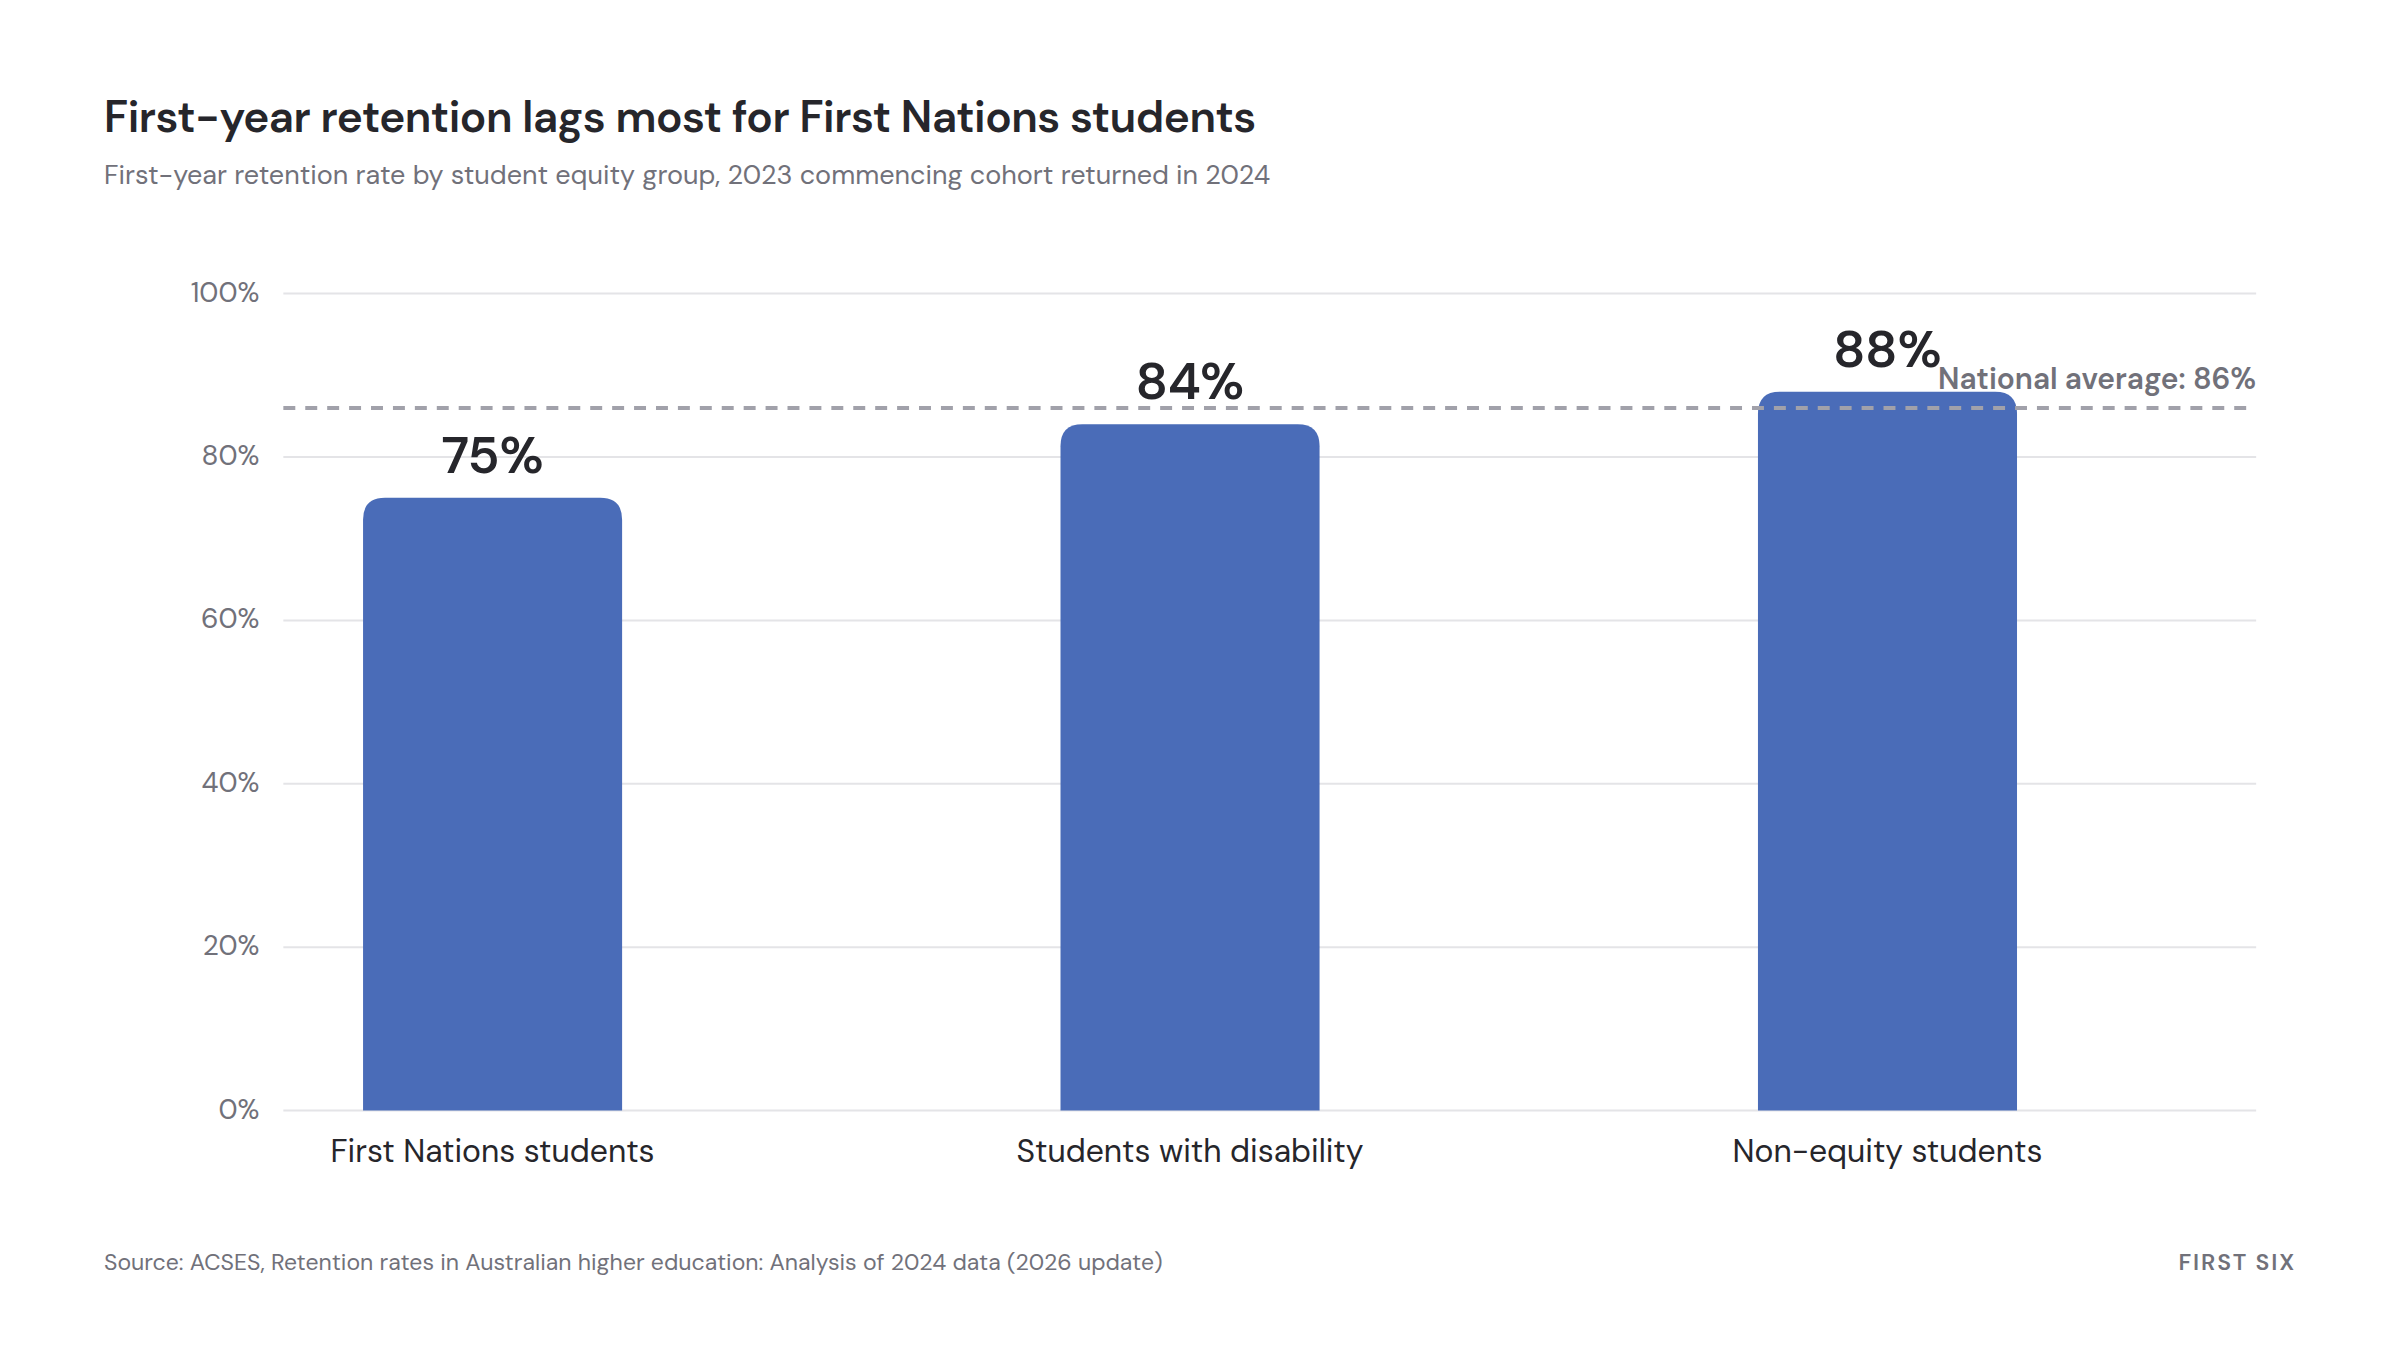
Retention and attrition are the same number read two ways, and the second reading is the more useful one here. A 75 per cent retention rate means one in four First Nations students who started a bachelor degree in 2023 did not return in 2024. An 88 per cent rate means roughly one in eight non-equity students did the same. First Nations students left at close to double the rate of their non-equity peers, not a marginal difference but a structural one. Students with disability, at 84 per cent retention, left at around a third more often than non-equity students, a smaller gap but a real one.
An average sitting at 86 per cent describes none of these experiences precisely. It sits above the First Nations figure by 11 points and below the non-equity figure by 2, which is not a midpoint so much as a number weighted by how many students are in each group. A national retention target, or a national retention headline, built around that average will read as success in a year when the group furthest from it is, at 75 per cent, the group least likely, by a wide margin, to be in its second year of study.
Why this is a compliance question, not just a reporting one
This gap is not only a matter for annual reporting. TEQSA's Compliance in focus: Identifying students at academic risk describes a 2021 review that looked specifically at providers' practices for international students, and found some providers lacked adequate systems to detect students who were not engaging or were falling behind, and to get support to them before they disconnected from their studies. The obligation TEQSA points to is broader than that one review: the Higher Education Standards Framework requires providers to monitor the progress and engagement of students generally, and to intervene promptly when a student is at risk, while the National Code adds an equivalent requirement specifically for international students. Providers are also expected to keep accurate records of at-risk students and report on progression and retention regularly to their academic and governing bodies.
The 2021 finding was about international students specifically. The standard it sits under is not. That is a mandate to notice domestic students at risk too, not just to report on them after the fact, and noticing is exactly where an average becomes a liability rather than a convenience.
The blind spot inside “the average student”
Here is the part a national statistics release will not tell you, and it is the part that matters operationally. An early-warning system, whether it is a spreadsheet a course coordinator updates by hand or an automated trigger on login frequency and assessment submission, has to be calibrated against something. In practice, that something is usually the behaviour of the typical student: how often they log in, how quickly they reply to an email from student services, how many missed classes or late assessments look like the start of a pattern rather than a bad week.
The problem is that “typical” is doing a lot of quiet work in that sentence. A first-in-family student who has never had a parent explain how deferred assessment works does not ask for an extension the way a continuing-generation student does; the silence looks like disengagement rather than the confusion it usually is. A student juggling shift work in a regional town does not show up to a drop-in session designed around an on-campus student's week; the absence looks like apathy rather than logistics. A threshold tuned to catch the average first-year student's risk signature will systematically under-trigger for the students whose risk looks different from average, and those are disproportionately the same students ACSES's 75 and 84 per cent sit under. Operating inside the first six months of a student's course teaches you this quickly: the students least likely to trip a generic alert are often the ones with the least margin for a missed intervention. A retention system built to manage the national average will, by construction, be least sensitive exactly where sensitivity matters most.
None of this means the improvement in 2024 was not real or was not worth having. It was both. But a sector that reports one national number and calls the year a win, without also reporting the 13-point gap underneath it and asking what its own early-warning thresholds assume about a “normal” first year, is reporting an average that, this year, no group of students actually experienced.
The number that should travel with the average
The fix is not complicated to state, even if it is harder to build than to describe: report the range alongside the average, and calibrate risk detection to each equity group's actual engagement pattern rather than to the sector mean. A university that can say its retention rose 2.6 points should also be able to say, in the same sentence, what happened to the gap between its highest and lowest-retained groups. If the answer is “we don't routinely look at it that way”, that is itself the finding.
2024 showed that broad-based improvement in first-year retention is achievable in a single year, across every equity group at once. The open question is whether the systems built to catch students before they leave are looking for the average student ACSES's national figure describes, or for the specific students its group figures show are twice as likely to leave.